🤏🏻 Selecting Markets
💡 When buying your property, it is best to look for markets with favorable buying conditions but generally within favorable markets tend to be seller’s markets. Real estate is local and location is the principal determinant of value. We can group them into two categories, the overall real estate market analysis and the neighborhood where you are buying or investing.
Real Estate Market Analysis
Which Metro do I pick?
💡 When starting out, it is recommended not to pick more than 2 markets to really focus on. Spreading your focus dilutes your ability to find deals.
In order of easiness and operations:
- A city within a 1.5 hour drive
- A city where you know someone local that can check in on a property for you
- usually the Subtle Asian Real Estate community can help you here
- Everywhere else in the country
Important Metrics for MSA
Demographics
- What is the Population?
You’re going to want a city with more than 100k people. It will make it easier for you to get loans and have a strong economy + tenant base.
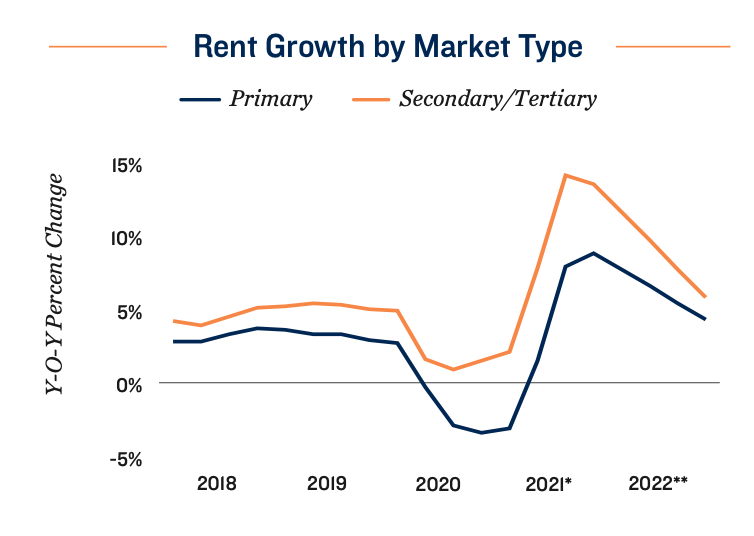
- Is it a primary, secondary, or tertiary market?
NY/SF/LA have been underperforming smaller metros like Phoenix and Austin for a while. There are bigger returns to be had by leaving the coasts, the South & South East sunbelt is currently dominating returns as of the last few years
- Is the Population Growing?
This tells you if people want to move to your city, ideally positive
- What is the racial distribution?
The more diverse, the more tenants you can market to and the more “hip” a metro tends to be.
Income
- Is the Income or number of jobs growing?
- This indicates your ability to increase rent
- More jobs = higher income = higher rent
- You’ll want it to be either equal or higher than the national growth
- What percentage of the population is below the poverty line?
- You’ll want something below the national average. Ties in to crime and the question above
- Who are the main employers? Is the job market diverse?
EG: in 1950s, Detroit was the fourth-largest city in the United States due to one industry (Automotive). However, the city suffered urban decay due to the deindustrialization, globalization, and discrimination which lead to its decline.
Not all tech jobs are made equal. Just because FAANG brought in a data center, distribution warehouse, or sales team doesn’t mean that it will actually do much to improve the economy of a city.
Preferably, you don’t want 25% of the jobs to be in a single industry
Un-controllables
- Do laws and ordinances favor tenants or landlords?
- Google recent news. If there’s a bill with rent control, don’t go there.
- How long does it take to evict a tenant?
< 1 month is preferred and goes all the way up to 6 months on average such as in California
- Is it in a flood zone or in an area where natural disasters tend to occur?
Tornado belt, Flood rating on Redfin and Zillow
Return metrics for comparing between cities
- Residential - Average rental income, CoC return
- Commercial and Multifamily - Cap Rate
- Short Term Rentals - Average Daily rate
Important Metrics for Analyzing Properties and their Neighborhoods
💡 Google maps is an easy way to pick out Points of Interest
What class neighborhood is the property in? If you’re not sure there’s a rule of thumb based on coffee
A: Craft coffee houses with unique names
B: Starbucks
C: McDonald’s & Dunkin & Krispy Kreme
D: No coffee. There aren’t many jobs in the area so they don’t drink coffee. (Sometimes this might just be a very residential neighborhood if you’re in a small town, which means there’s a lot of homeowners in the area/possibly very few renters)
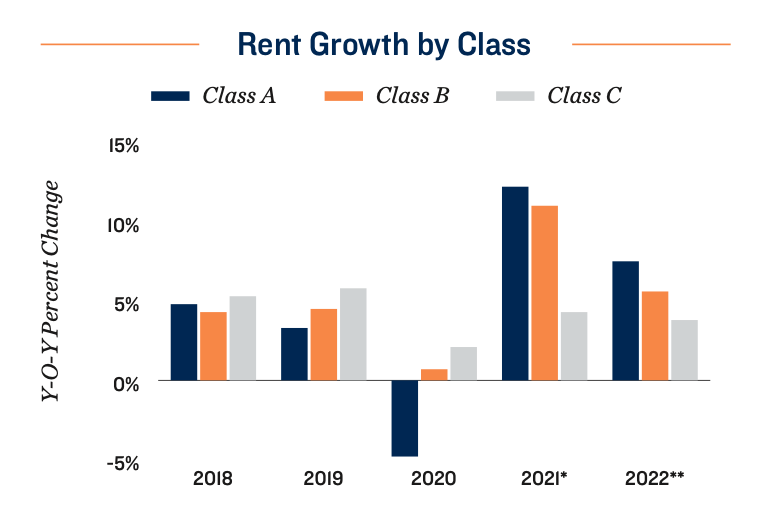
Class A properties are the riskiest. Often times, those tenants will downgrade in an economic downturn from class A→B, class B→C, and so on. Fun fact, in the 08’ recession, certain neighborhoods had the rent go up since all the people who were evicted still needed a place to live
Other important metrics
- Is it suburban or urban?
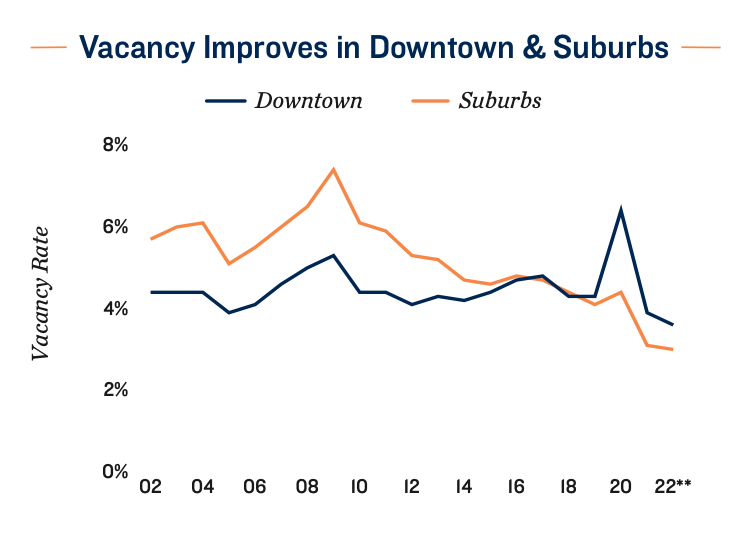
Since the great recession, suburbs have outperformed and it’s currently projected that suburban real estate will still continue to beat out urban property returns.
- Proximity to good schools + average school rating
The better the school, the better the neighborhood
- Proximity to companies with good jobs
B class neighborhoods will generally be closer. A class neighborhoods tend to be further away from businesses.
- Median Home Value
Higher values = better neighborhood. Try to figure out the range for your city and don’t target the highest.
- Median Income
Higher income = better neighborhood. Figure out if it’s high level executives or young, well-paid finance/tech employees. One will be a better renter than the other.
- Occupancy / Vacancy Rates
Higher occupancy = easier to raise rent due to demand
- Percent Employed
More jobs = higher incomes as jobs compete for employees = higher rent
- Which percentage of population are renters? How old are they?
Too many homeowners means you’ll get fewer renters. Younger people are also more likely to rent. You’ll want at least half of the neighborhood to be renters.
- Crime Rate
Higher crime = worse tenant base. Check spotcrime.com for your neighborhood. Most dense cities tend to have a lot of assaults/minor theft which isn’t an issue, keep an eye out for arson and shootings.
- Is it in a flood zone or in an area where natural disasters tend to occur?
Insurance tends to go up in flood zones or you will need to pay more of cashflow out for flood insurance
Learnings from Papa Nelson's Data Analysis
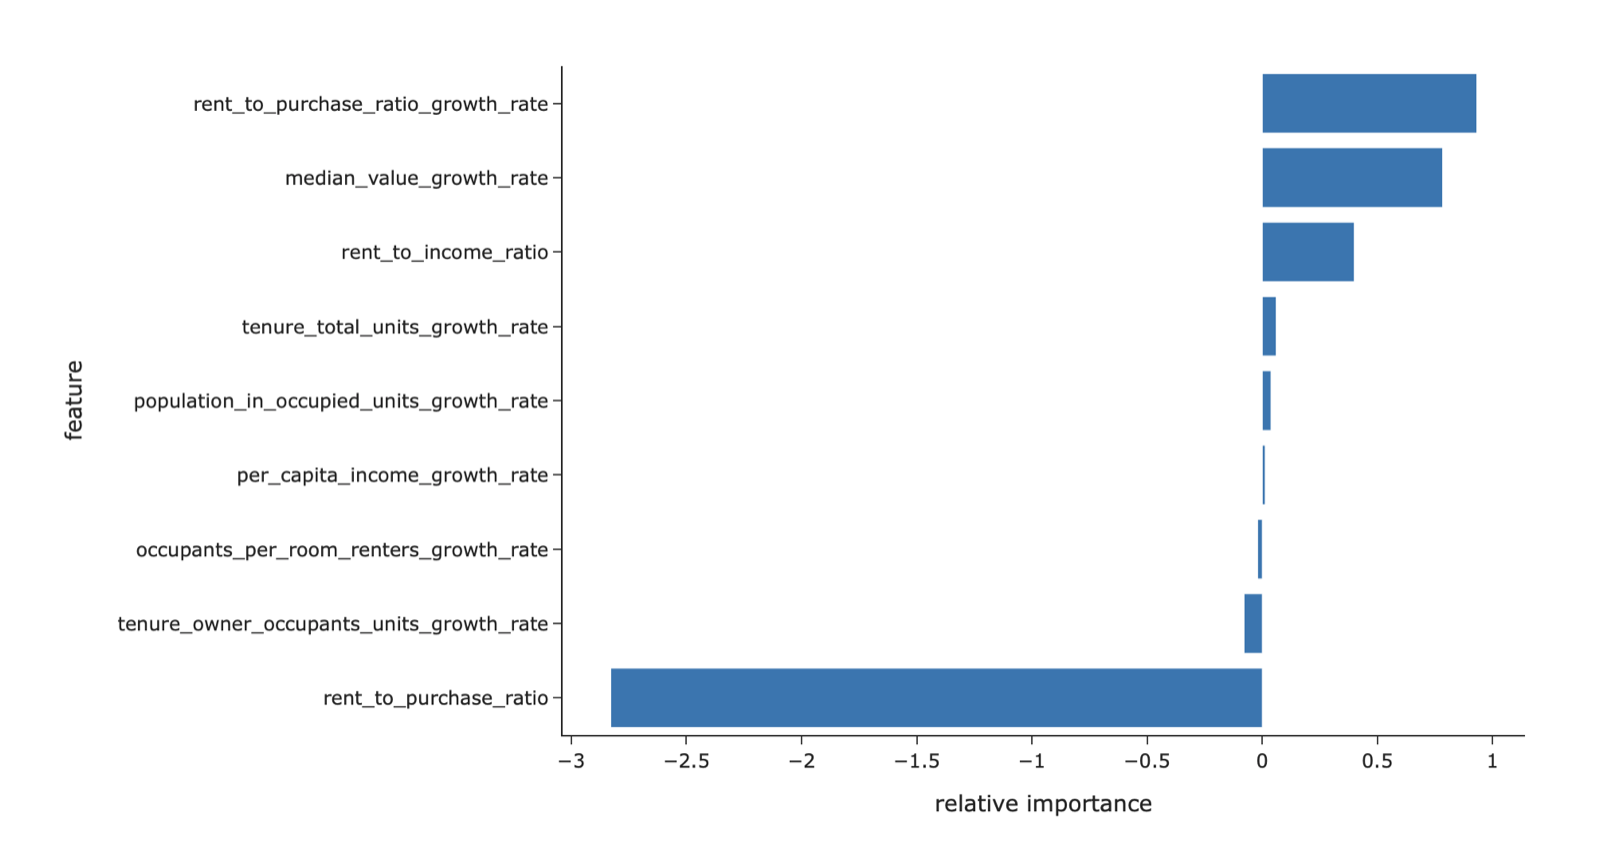
Metrics that don't affect valuations/rent growth in SFH according to the census
- Crime rate has no effect.
- Reason listed above, dense metros have more crime but renters like those neighborhoods.
- Rent/purchase ratio limits rent growth, but grow faster in valuation. This just means C/D class properties appreciate faster, but have slower rent growth.
- Population growth doesn't always correlate to value/rent growth. It is not the most important metric, just small one. There’s often a chicken and egg problem, do people move to city because jobs and income are good - thereby driving up prices? Or do many people moving to a city up prices and income.
Data Sources
Justicemap.org
- CT & Block HH Income
City-Data.com
- Income. Higher income areas generally have expensive single-family homes, which aren't great for cashflow.
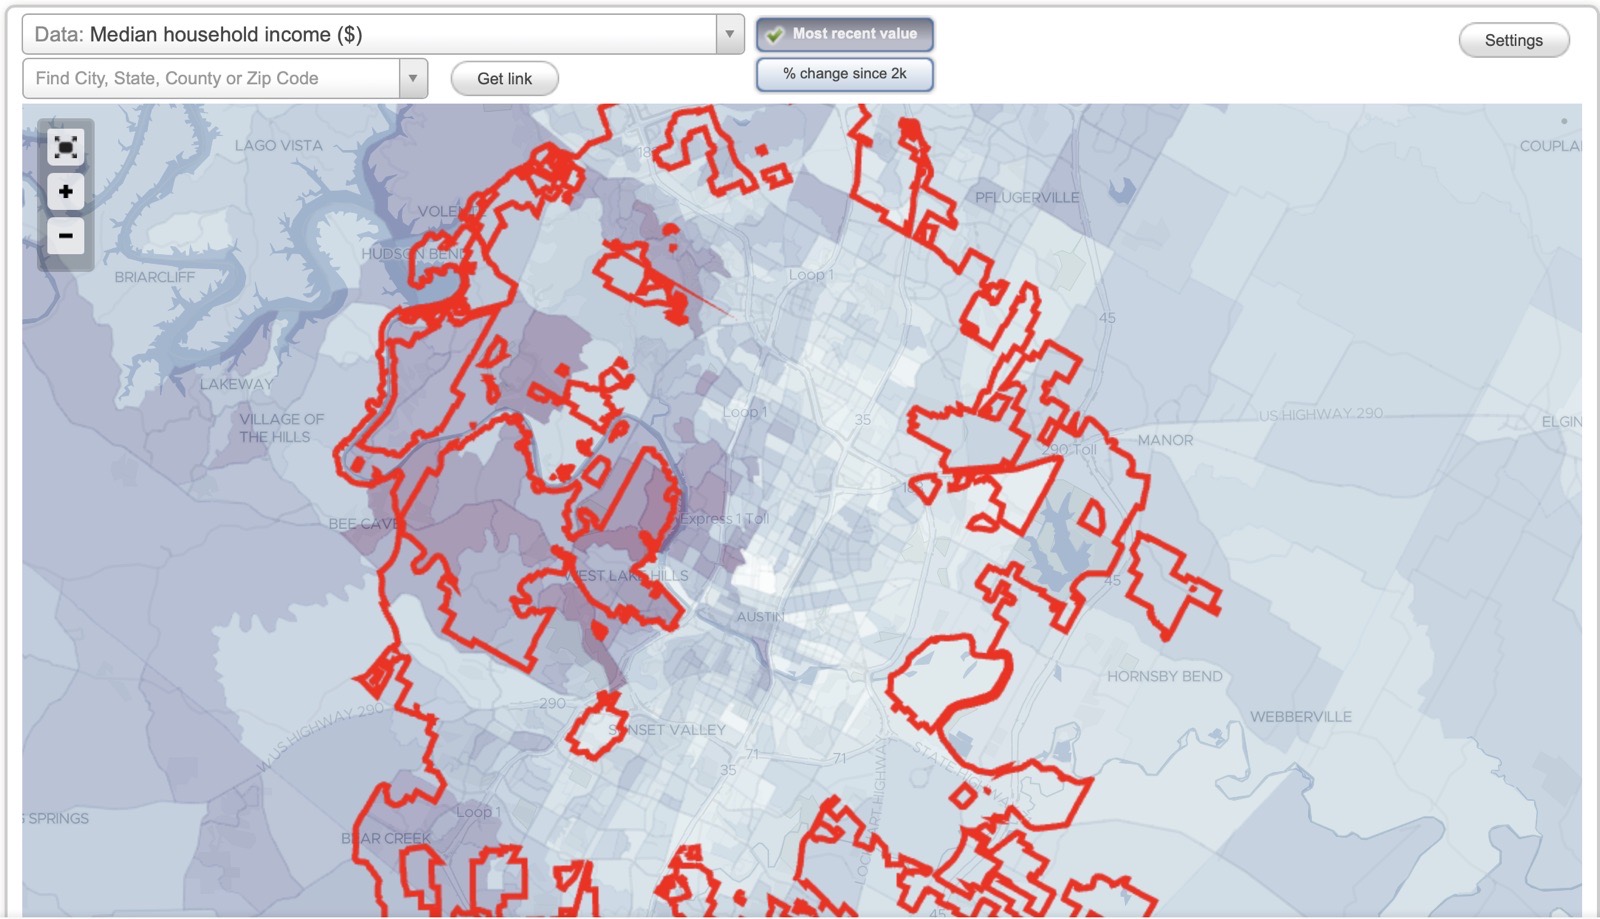
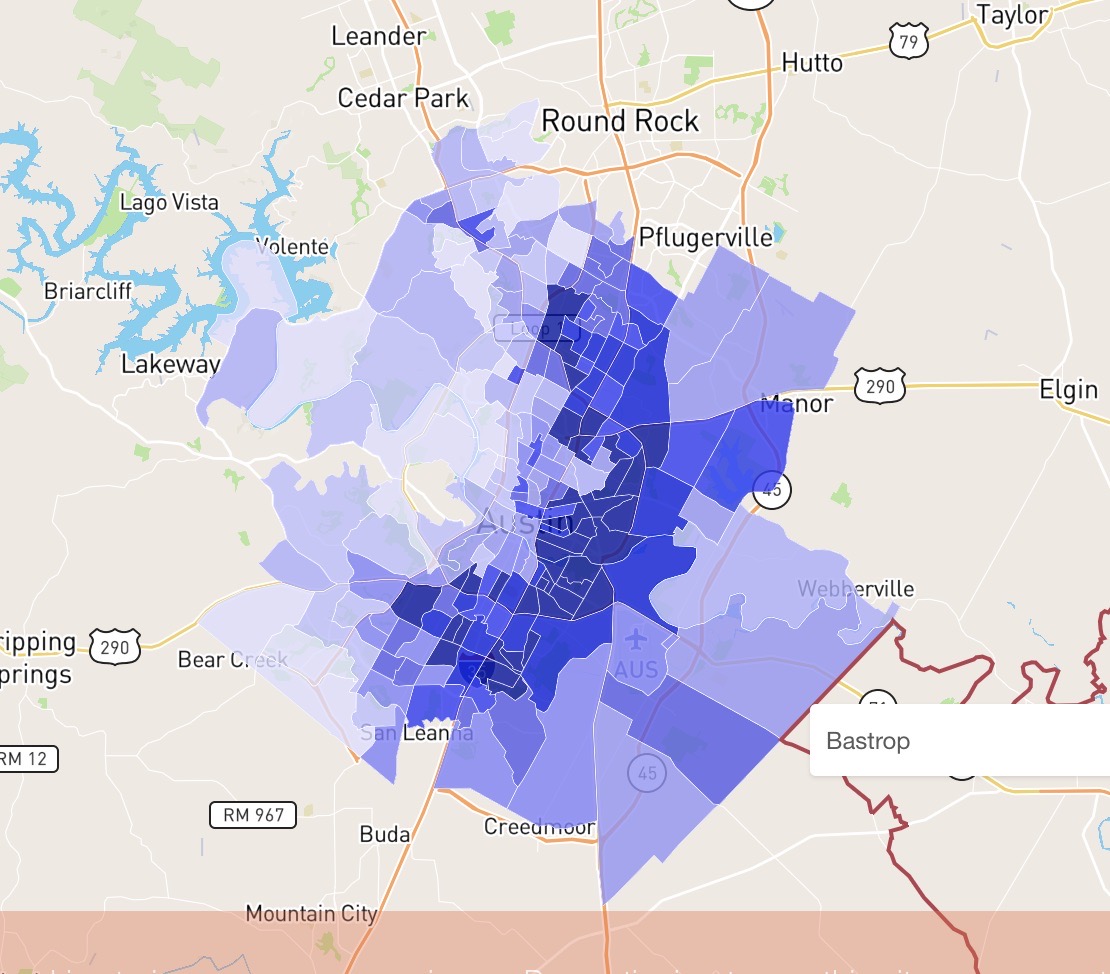
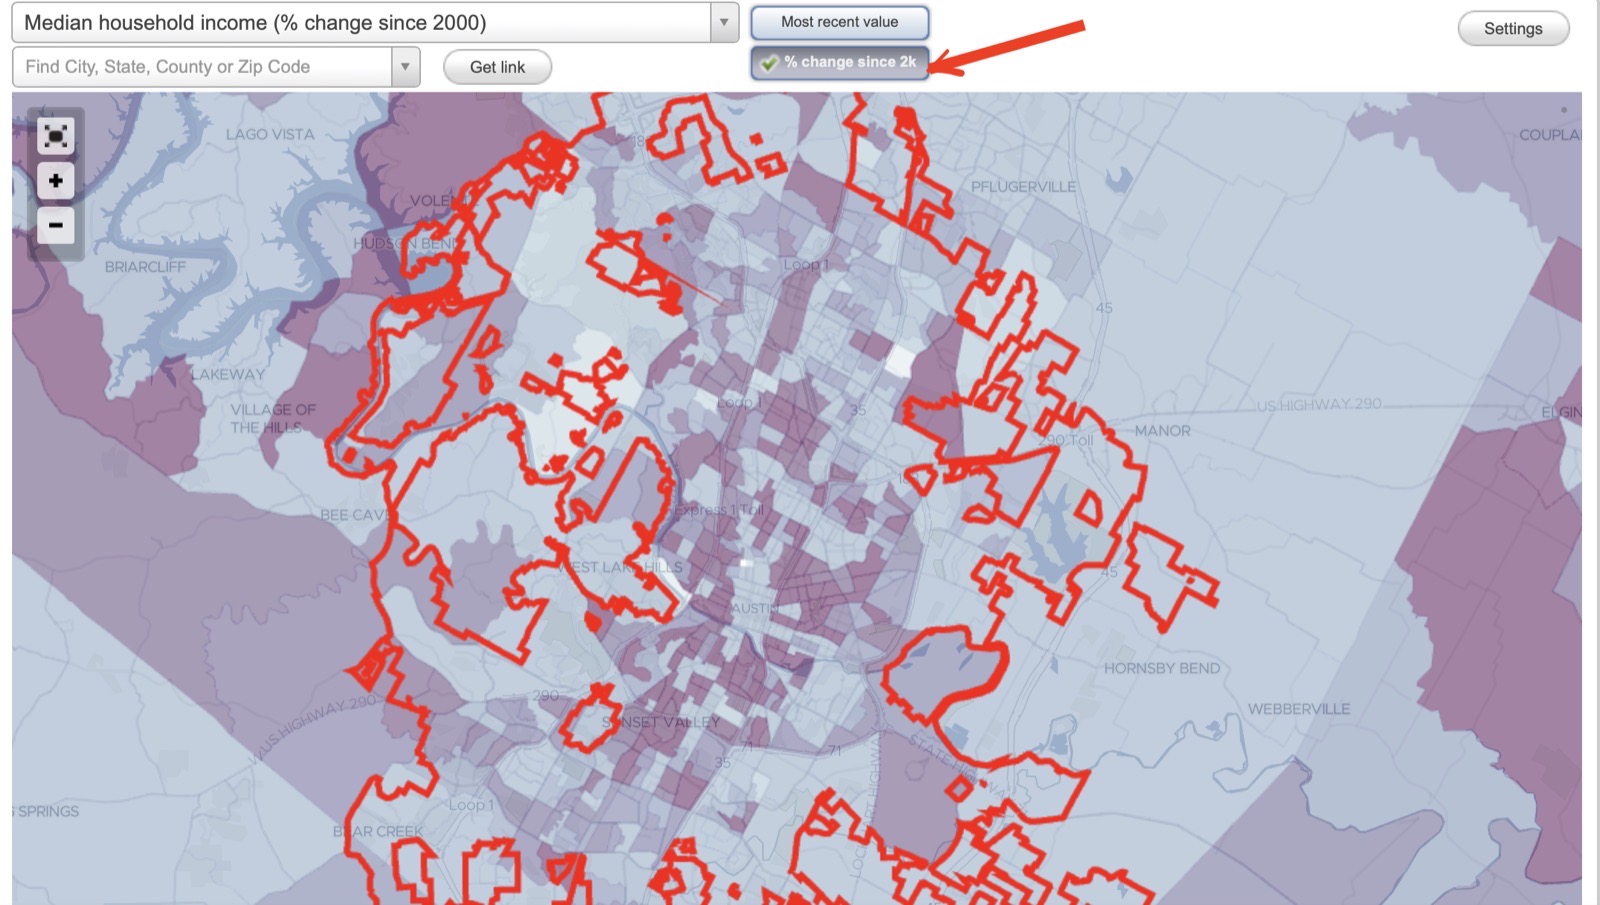
- Income growth = rent and valuation growth. Click the other box to see change since 2000 to figure out path of progress. Generally expands out of the rich part of town. For example, despite population decline in the bay area, prices keep going up because of the influx of tech money and low supply.
- Home valuation growth. Another way to see path of progress. Increases in single family home prices usually leads to a delayed increase in rent. For example. Austin values exploded first by 40% in 2020 which led to a 25% increase 6 months later.
Neighborhood Scout
- School Scores. Better schools = higher rent/income
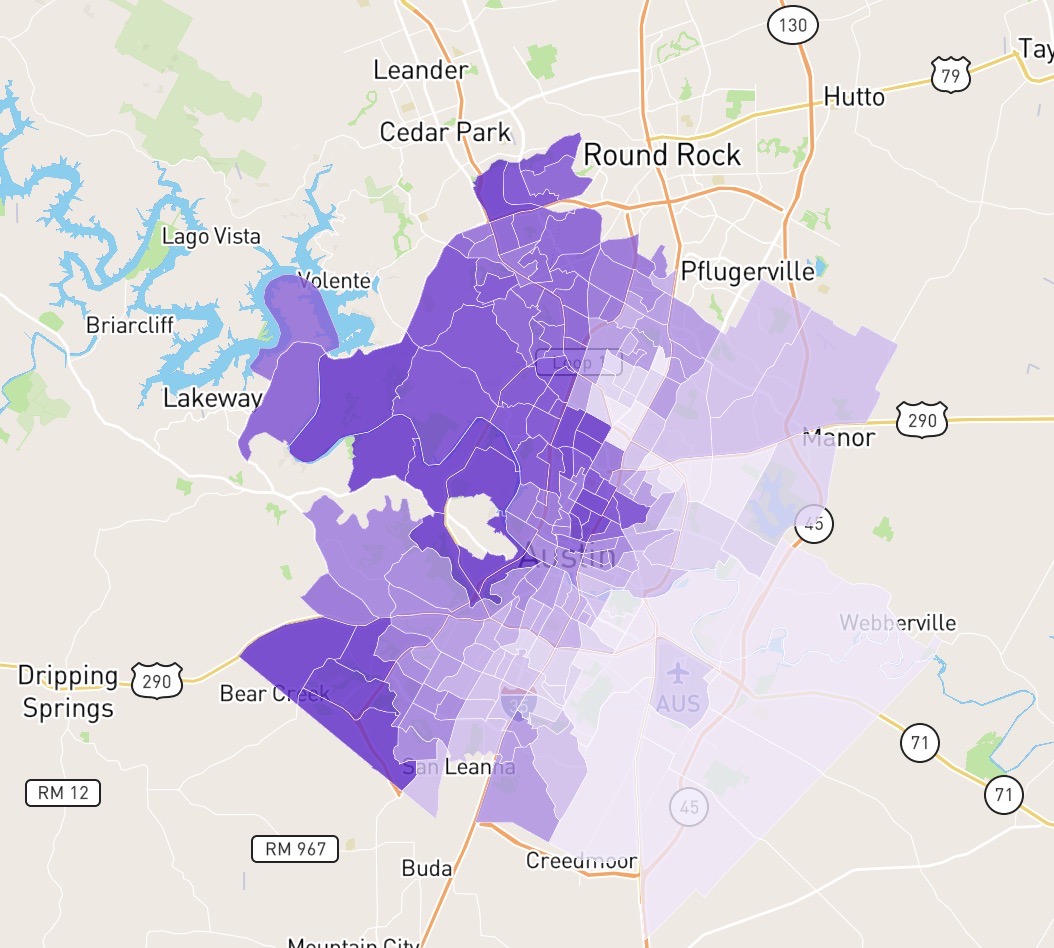
- Crime Rates. Rougher neighborhoods have an inverse correlation to wealthy neighborhoods